New! Test out updates to school grades using this online tool
2/3/2014
Florida's school grading system is the oldest in the nation, and has undergone dozens of changes to the way grades are calculated since it was first implemented in 1999. This year the state will once again need to make some significant changes to the formula to reflect new standards and assessments being adopted.
Recently, we released a policy brief outlining some broader changes we believe the state should consider during this process to make grades more stable and meaningful moving forward. Now you can use the interactive visualization below to see what the impact of some of those changes might mean for the state, your district, or your school.
***CLICK HERE TO EXPLORE DATA NOW***
In our policy brief, Understanding and Updating School Grades for Florida's Future, we explore five major recommendation areas we believe the state should be considering during this unique opportunity in order to resolve some of the most persistent concerns about the current school grading model in recent years. Those areas are:
- Emphasize student growth, and measure it over multiple years instead of just one.
- Spread the grade ranges more evenly to avoid instability.
- Change the formula only every few years.
- Use student growth and proficiency separately to ensure schools are rewarded or penalized based on performance, not demographics.
- Broaden and align the components of the accountability system.
In the visualization below, you can use the drop-down menus on the right-hand side to see what the impact would be in terms of total points earned and grades assigned for some different combinations of some of these suggested changes.
It is important to note that due to data limitations, the options below only reflect some of the suggested options to consider outlined in the brief. For example, under the recommendation area "Emphasize student growth, and measure it over multiple years instead of just one." we detailed multiple potential alternatives for measuring growth, including multi-year averages, cohort models, and value-added modeling. Because access to the raw data that would be required to measure the impact of potential cohort or value-added models is not publicly available, the visualization below only includes the option of different multi-year averages of current growth score calculations. We recommend reading the full policy brief to get a more complete sense of all the options we believe the state should be considering during this process.
Despite these limitations, the visualization can help provide a clear sense of what the impact would be of making certain changes in how growth is calculated, how much growth is weighted, and what the points thresholds are for each grade.
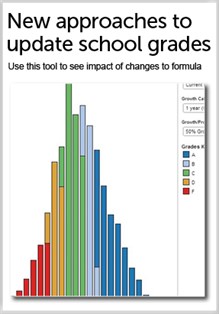
In tabs (1), (2), and (3), the upper image shows what the distribution of schools would have been in 2013 in terms of total points earned under the model parameters selected. The lower image shows a running total of how many A, B, C, D and F schools there would have been in that same scenario. Tab (4) allows you to select a specific school and see in more of a report card format how different changes selected would have effected that school's grade in 2013.
Some important notes to keep in mind as you use the visualization:
- All projected grades are based on points earned alone. Projections do not account for business rule provisions such as one letter grade drop protection (i.e. "safety net" rule). Because of this, even when all parameters are set to match how grades were calculated in 2013, totals will not match exactly the number of grades awarded in 2013, but will more closely represent what grades would have been without any additional rules.
- To use tab (4), you must select an individual district and school from the drop-down menus on the right. In order to use tabs (1), (2), or (3) again after that, be sure that the "Select School" option in tab (4) is set back to "(All)".
- For more explanation of what some options mean, such as the Equidistant scale, please see full policy brief.
(Tip: Hover your cursor over a bars to see more information about the results. Use the drop-down options to the right of the graph to change districts or model parameters available.)