What’s New: Taking a Closer Look at 2014 School Grades
7/31/2014
 School grades for elementary and middle schools are out for the final time under the current model. This is the final year that the FCAT 2.0 will impact school grades, as next year schools statewide will adopt Common Core standards and Florida Standards Assessments.
While the tests that Florida school grades are based on will change, the school grades formula will continue to look at both students' passing rates ("proficiency") and learning gains made from year to year ("growth") on those tests for measuring a school's performance.
***CLICK HERE TO EXPLORE DATA NOW***
As we have looked at in previous years, these two measures of performance reflect very different things about a school, and should be each considered separately with as much attention as the overall school grade itself. As a reminder:
- Proficiency is primarily a measure of student performance (i.e., how well are students performing at meeting appropriate performance targets?)
- Growth is primarily a measure of school performance (i.e., how is this school doing at moving students forward at or above an appropriate rate each year?)
While tracking both of these measures is valuable, combining them to produce a single score can make it difficult to more meaningfully assess a school's strengths and weaknesses. By doing so, it is often hard to differentiate between the work a school is doing and the influence of external factors on a student's growth.
To get a more clear understanding of what is happening at a school, one recommendation we always suggest is to be sure to look at growth and proficiency separately.
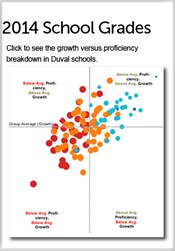
In this visualization, we broke down the recently released 2014 elementary and middle school grades into the sum totals of their proficiency (horizontal axis) and growth components (vertical). By doing this, we can easily see more detailed information about how schools are performing that the overall school grade may not provide.
For example, looking across the different quadrants we can now see some schools which all received the same grade this year, but clearly have different strengths and needs, such as:
Carter G. Woodson Elementary (low proficiency, low growth): C
Crystal Springs Elementary (low proficiency, high growth): C
Pine Forest Elementary (high proficiency, low growth): C
What else do you see going on in the data?
As the state continues moving forward on finalizing the new school grades formula over the coming months, we encourage everyone involved to continue thinking about how to calculate and use growth scores most effectively for identifying schools that are truly doing the best jobs at moving their students forward.
For a more thorough explanation of this and other recommended ideas to consider for the new school grading formula, please refer to out most recent policy brief available at jaxpef.org/schoolgrades.
(Tips for using the vizualization: Hover your cursor over a mark to see more information about that school. Use the drop-down options to the right of the graph to change districts or sort by school type, use the tabs above the graph to switch between school levels. For iPad or iPhone users, tap the visualization to interact with these features.)
---
Jonah Kitay