News


Does the United States Spend Enough on Public Schools?
In a fascinating new paper, Harvard, Duke, and University of South Florida economists and researchers pose the question: is spending so little (relative to similar economies) on teacher salaries optimal? A deep review of all known causal studies suggests that school spending has a direct impact on improving student outcomes (Jackson& Mackevicius, 2021), four years of increased, consecutive school spending will improve test scores over 90 percent of the time.


Events


Annual Event
EDDY Awards
The EDDY Awards honor exceptional educators across Duval County’s public and charter schools by recognizing their outstanding contributions to student achievement and the educational community. This gala event celebrates all Teacher of the Year candidates, highlights the top five finalists, and announces the county’s Teacher of the Year, who will go on to compete in the state-level competition. In addition to public recognition, winners and finalists receive professional development opportunities to further enhance their skills and impact on education. The EDDY Awards also raise public awareness of the critical role teachers play and foster community support for education.
The 2026 EDDY Awards will be held on Saturday, January 24, 2026, at the Hyatt Regency Jacksonville Riverfront.
Annual Event
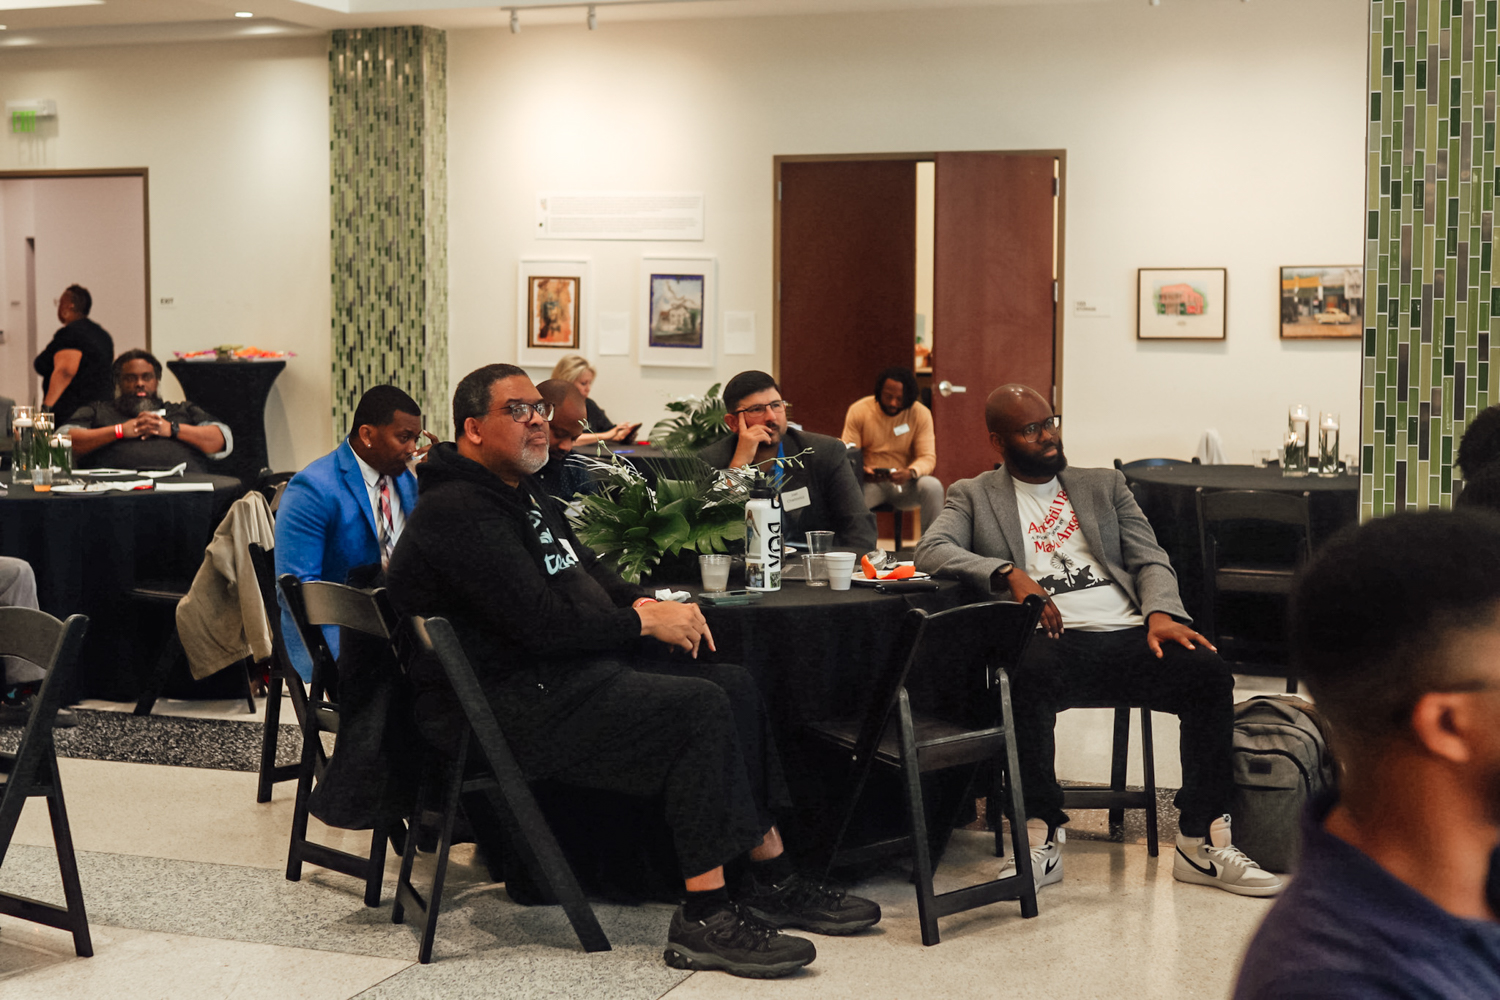
Lift & Lead Annual Conference
The Jacksonville Public Education Fund hosts the "Lift and Lead" conference, an annual event focused on equipping and empowering Black and Latino male educators while welcoming and supporting all stakeholders in Duval County education. This conference offers a platform for educators to gain essential tools to enhance their teaching practices and advance their careers. It also provides opportunities for networking, socialization, and the exchange of valuable insights among Black and Latino teachers and the broader educational community.

Annual Event
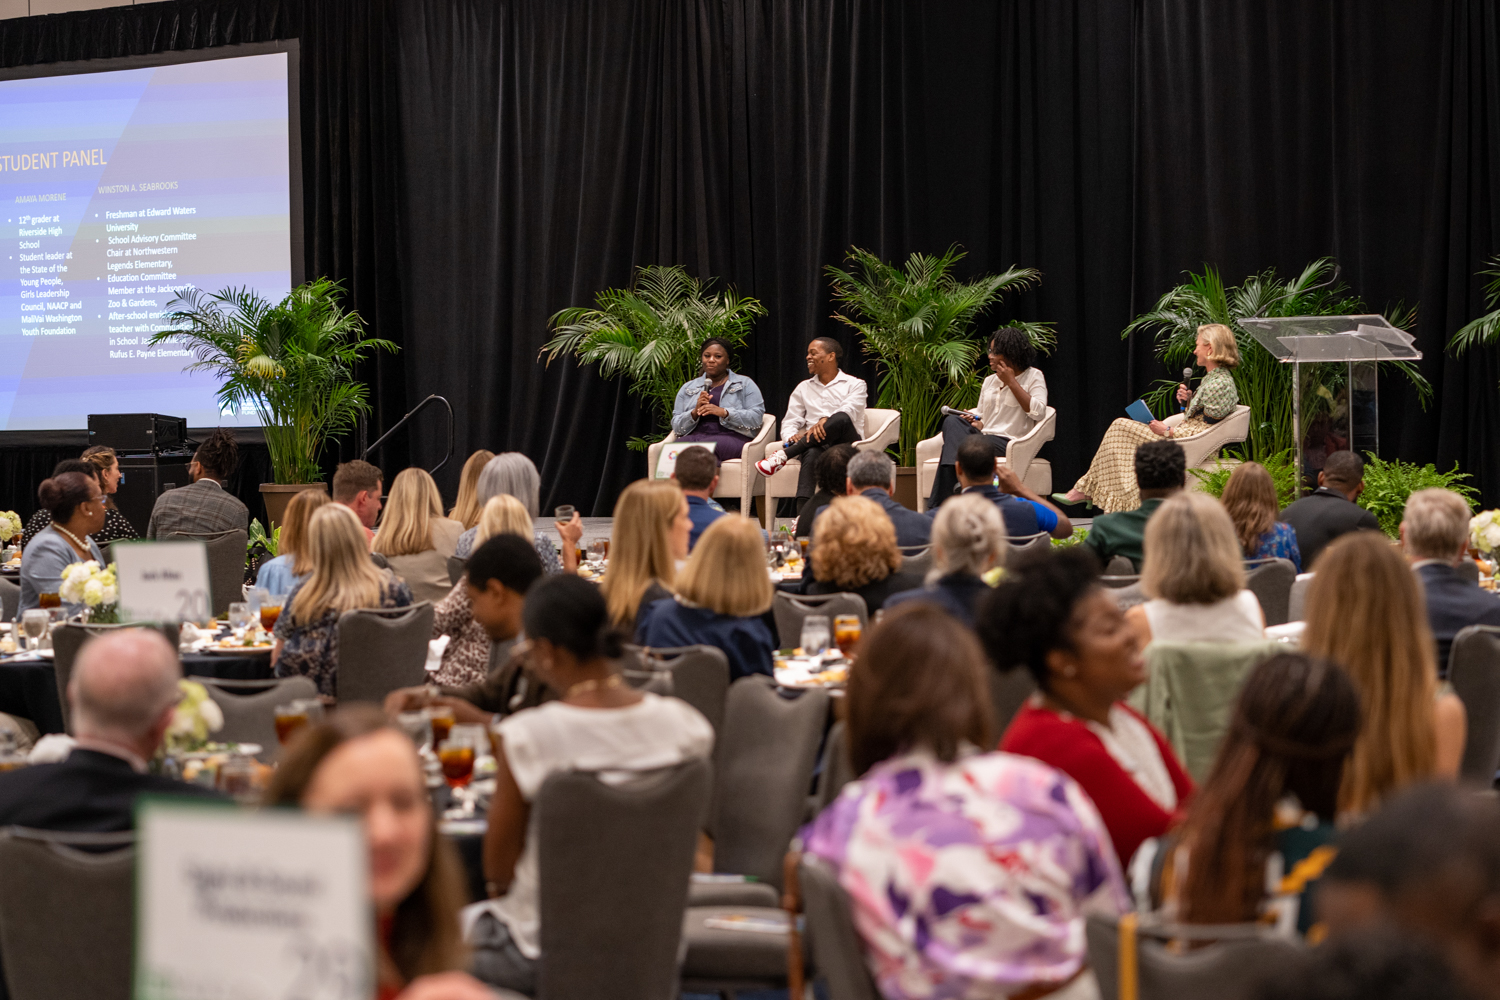
Urban Education Summit
The Jacksonville Public Education Fund (JPEF), in partnership with My Village Project and 904ward, hosts this annual event to advance progress and innovation in urban education. The event convenes educators, students, parents, community advocates, and nonprofit organizations collaborating with schools. This gathering fosters a diversity of perspectives, providing participants with a deep understanding of the challenges in urban education and equipping them with actionable solutions for lasting impact, ensuring that all stakeholders are involved in the decision-making process.
Biennial Event
EDTalks
The Jacksonville Public Education Fund hosts this biennial event bringing together leading voices in education to share innovative ideas, best practices, and successful approaches from across the nation and around the world. This event inspires education leaders, supporters, and partners to take meaningful action and collaborate on addressing the critical challenges facing our students. EDTalks serves as a platform for sparking new ideas and driving positive change in our community’s educational landscape.